The numbers are people: Using data to manifest your commitment to equity

By: Dr. Sophia Bolt
Analyzing data is imperative in any equity journey. If your school or district is serious about its commitment to advancing equity, data analysis must be a part of the equation. Data analysis is critical to answering such questions below, answers to which are crucial to addressing barriers to equity:
- Which students disproportionately receive harsh disciplinary action, including in and out of school suspension?
- Where are their opportunities to de-escalate? Who is receiving disciplinary action for the most subjective behavioral categories such as insubordination, disrupting instruction, and defiance?
- Which students have access to and enroll in advanced or honors courses?
- Which students are taught by the most experienced teachers?
- Which students are enrolled in extra curricular activities, sports, and organizations?
- What patterns exist in your graduation rates and higher education access?
- What are your hiring and retention patterns over the last 5-10 years? Who is staying and who is leaving?
See a list of all data points that RE-Center reviews when assessing the equity portrait of a distinct.
While quantitative data points are important, the below are examples of more qualitative research questions that school leaders must also aim to answer:
- What makes students feel they have a sense of belonging in our school/district?
- How do new students and their families know and feel they are welcome?
- What changes (in a classroom or the school) would students, families, and staff like to see? Why are they needed?
- What current practices of staff are making them proud right now? Where do they continue to find challenges?
Asking these questions can happen through climate surveys, town halls, in individual classrooms, and in one-on-one talks with students, staff, and families. As Shane Safir and Jamilia Dugan, authors of the book Street Data: A Next Generation Model for Equity, Pedagogy, and School Transformation, explain, “This is the power of street data. It offers us insight into localized cultural models that, if we dig deep, illuminate the root causes of inequities as well as places of opportunity and cultural wealth” (p. 59).
Without thorough and continuous practices of evaluating data, critical questions will go unanswered, and inequity will continue to fester. Using data to address equity works to help fill in the picture of root causes, helps leaders make more informed decisions, and results in a greater likelihood of implementing needed changes.
It is also important how you look at your data:
Using an equity lens to analyze data means that you look not only at the raw numbers, but that you look for areas of disproportionality in disaggregated data. For example, it is important not only to know how many suspensions there were in a certain time period, but also the breakdown of those suspensions by different identity groups, such as race, gender, socio-economic status, and special education classification, and their intersections (i.e. suspension of Latinx males). From there, disproportionality can be seen by looking at the rates at which one group is suspended over the other.
For instance, Black students in a school may have fewer suspensions than their white peers when looking at the raw numbers, but upon deeper analysis, you may see that while the suspension number is lower, Black students, based on the population size, are actually more likely to be suspended than their white peers. Or, in another instance, you may see that while Black students make up 16% of the student population, they make up 30% of students who were suspended.
See the graphics below. Graph A shows the raw numbers of suspensions in a sample district by race, while Graph B shows the disproportionality of suspensions showing the population proportion of each racial group vs suspension proportion.
|
Graph A - Raw Numbers |
Graph B - Disproportionality |
|
|
|
|
*Students counted only once, even if multiple suspensions |
*Students counted only once, even if multiple suspensions |
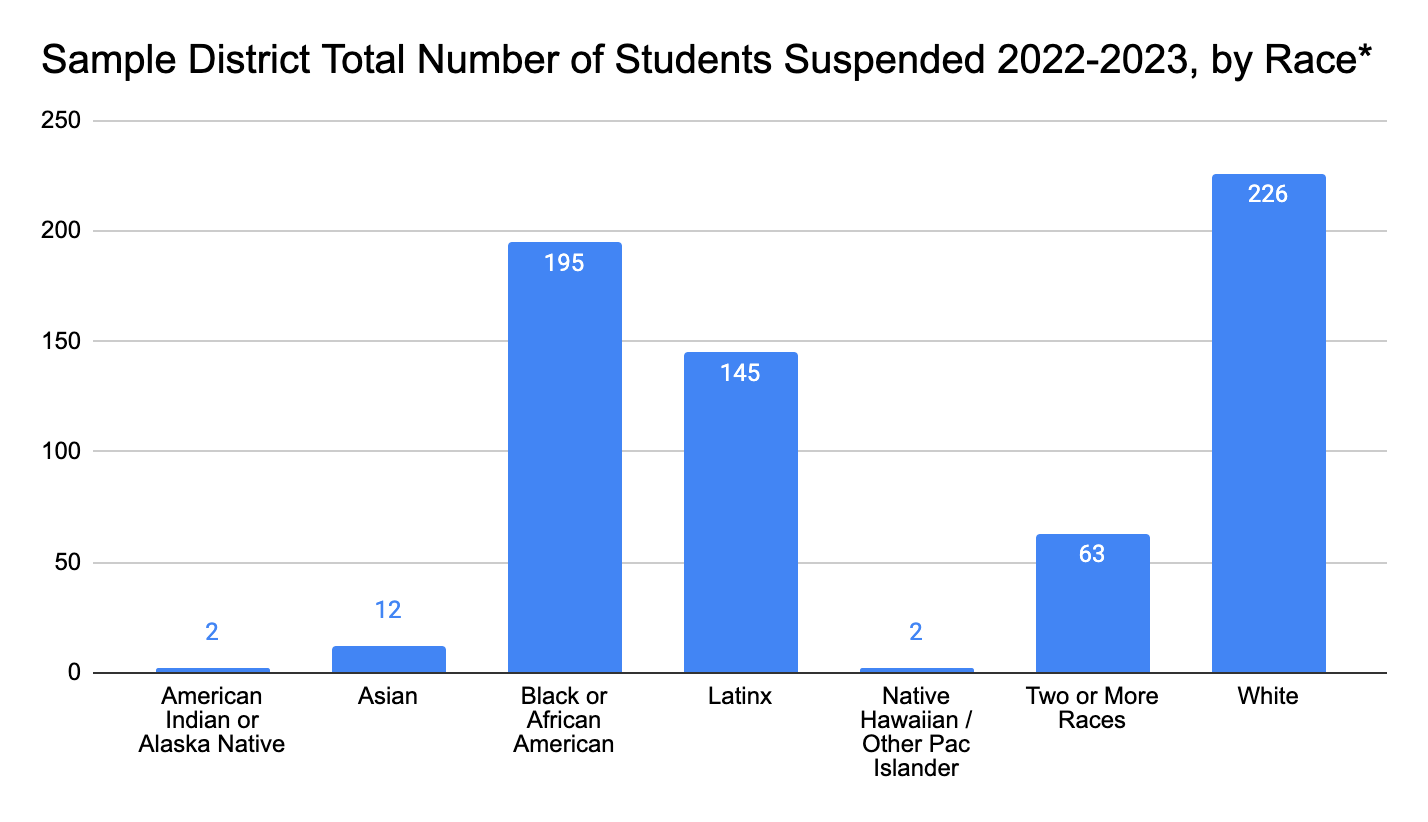
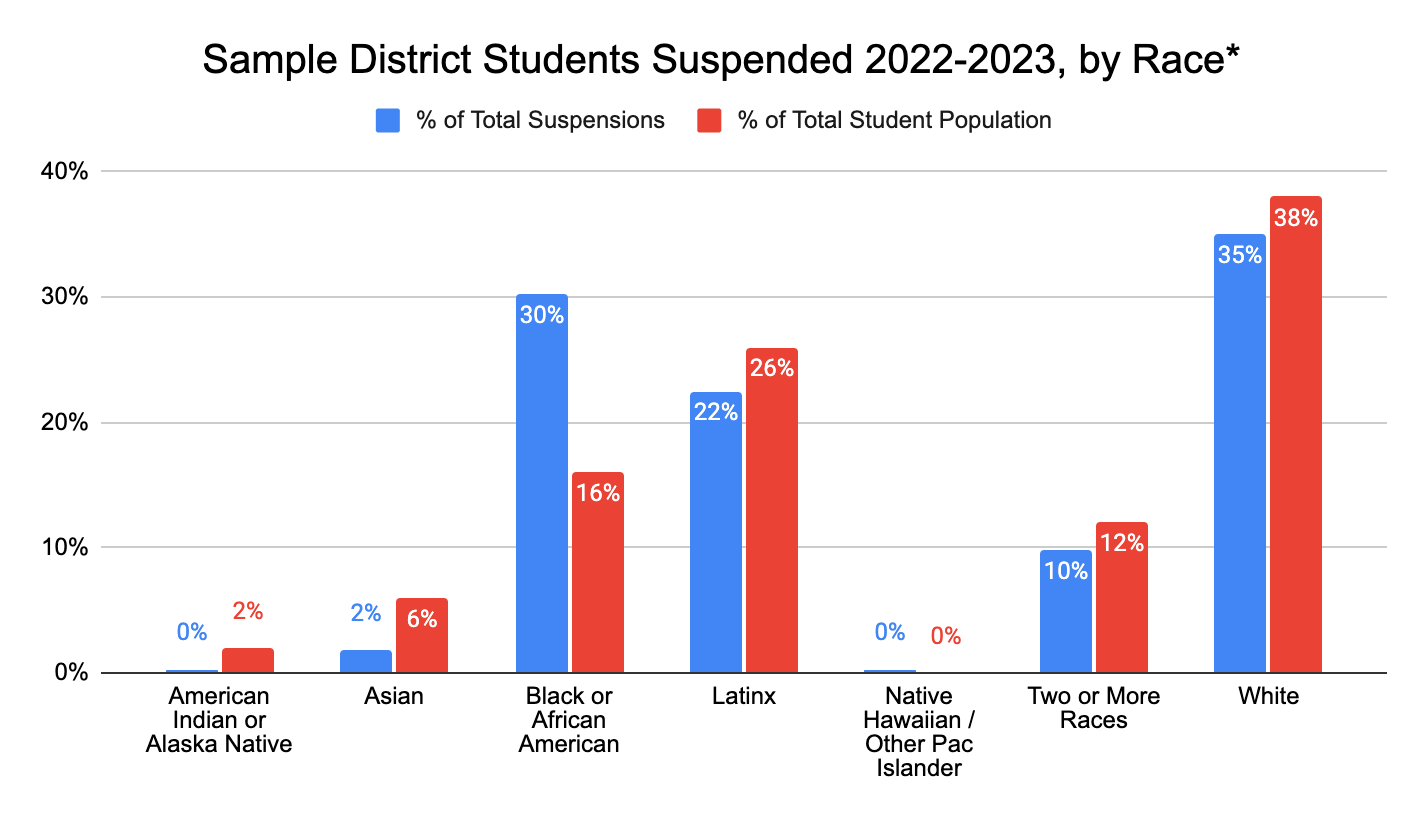
Based on raw numbers, one may not see inequity as white students have the highest number of individuals suspended, but looking at the second graph, one realizes the vast disproportionality in the numbers when comparing them to population proportions (i.e. Black students are disproportionately suspended compared to their peers). Additionally, because suspension data is outcome data, you actually want to be analyzing your disciplinary referral data such that you can get closer to the behavior that occurred, any triggers, and persistent relational issues. If you are only looking at disparities in suspension and expulsion data, you are missing a huge opportunity to get to a level of depth in your root causal analysis.
To achieve that level of depth in root causal analysis, looking at data disaggregated is necessary for all types of data you collect, qualitative and quantitative. We must ask how different groups are answering the same questions and what similarities and differences exist. The questions do not end after data has been analyzed. As part of your data analysis practices, school leaders must also ask:
- What does the data tell us?
- What doesn’t it tell us?
- What more do you want to know?
- How will we go about gaining additional information?
(McCabe Zwerger, 2022)
The last question is crucial. Data collection and analysis must be an ongoing process throughout the school year. As you gain more information, you often gain more questions, all which help to further illuminate the equity portrait of your school or district and highlights barriers and pathways to equity.
We often see schools and districts review their data at the end of the school year. This, however, does not allow for data to inform decision making during the school year. Think about the power of seeing a disproportionality pattern after the first quarter and implementing actions to address it, rather than waiting until the year is over to uncover harmful patterns.
Is continuous data collection a big undertaking? Yes. But if your commitment to equity is authentic, then you will make it a part of your practice. We recommend looking to Dr. Eddie Fergus’ book, Solving Disproportionality and Achieving Equity: A Leader's Guide to Using Data to Change Hearts and Minds, for insights on how to implement your own data analysis plan. Addressing inequity must involve uncovering the root causes, and that cannot be done without collecting and analyzing your data with an equity lens, and on a regular basis. What are you waiting for?